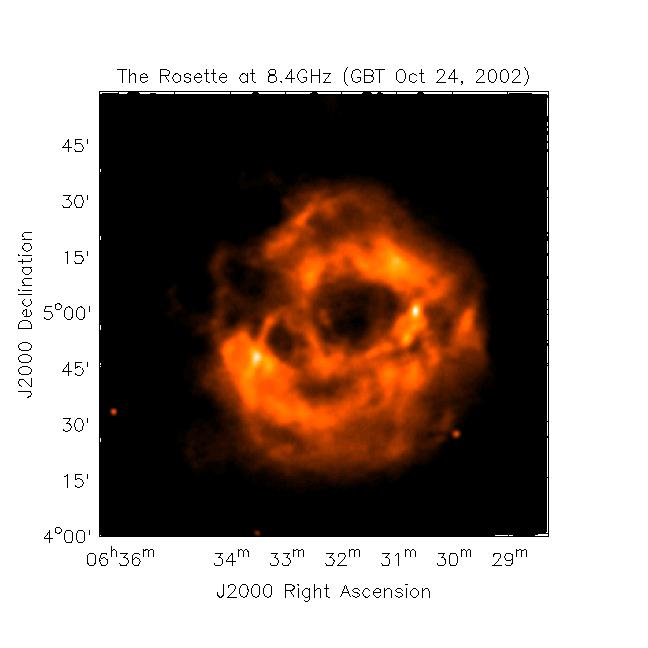
Notes on processing the Rosette image:
The initial image was made using the 'gbtcalutils' package of aips++.
Gbtcalutils processes single-dish on-the-fly scan data and uses
the more general aips++ 'imager' utility to grid the images.
The Rosette data was an on-the-fly map with the scanning in the
RA direction. Gbtcalutils was told to subtract a linear baseline
from each RA stripe, fitting to the first and last 10% of each stripe,
and gridding the data to form an image.
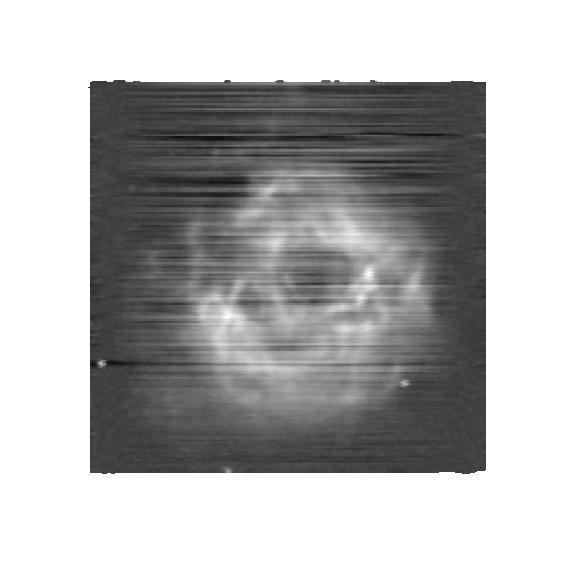
Figure 1
shows the initial "dirty" image.
The horizontal stripes are due to variations in sky background during
the 4 hour observation. One may also note a registration (or hysteresis)
problem with alternate scans which were taken in opposite directions.
This problem has been mostly fixed by software improvements done
since this image was made.
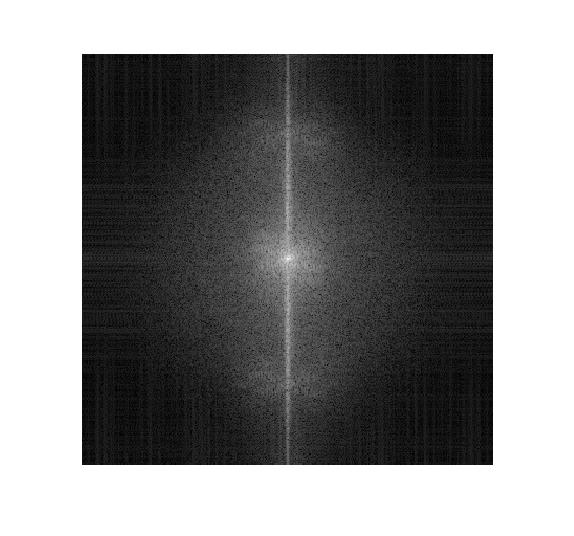
Filtering and smoothing was done in the fourier transform domain to
remove the stripe artifact and to hide the hysteresis.
Figure 2
shows the fourier transform of Figure 1. The vertical streak is due
to the stripe artifact.
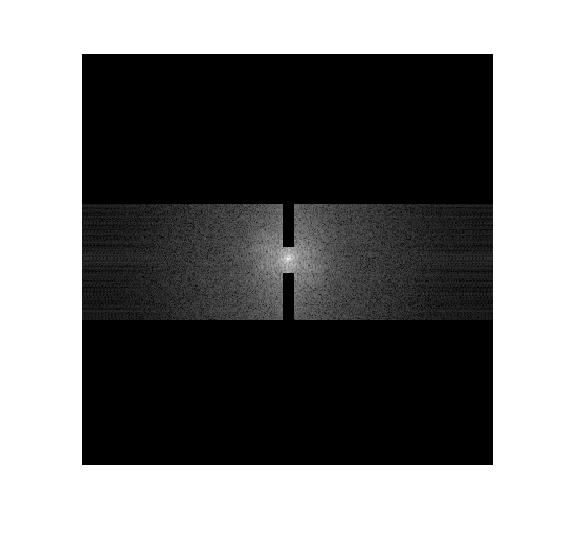
Figure 3
shows the transform of the image after applying a mask to remove the
vertical feature and to cut out the higher-frequency part of the image.
The transform of this masked fft is the final processed image.
The maps were produced with aips++, using 'gbtcalutils.g'. I added baseline subtraction to these utilities, which improved the images somewhat. One can still see streaks in some of the maps due to imperfect baseline subtraction. One can also see some hysteresis, especially in the Tycho map, showing that forward scans do not register exactly with reverse scans.
The Omega Nebula (M17) (a star-forming region)
W3(OH) (a star forming region)
The remnant of Tycho's supernova
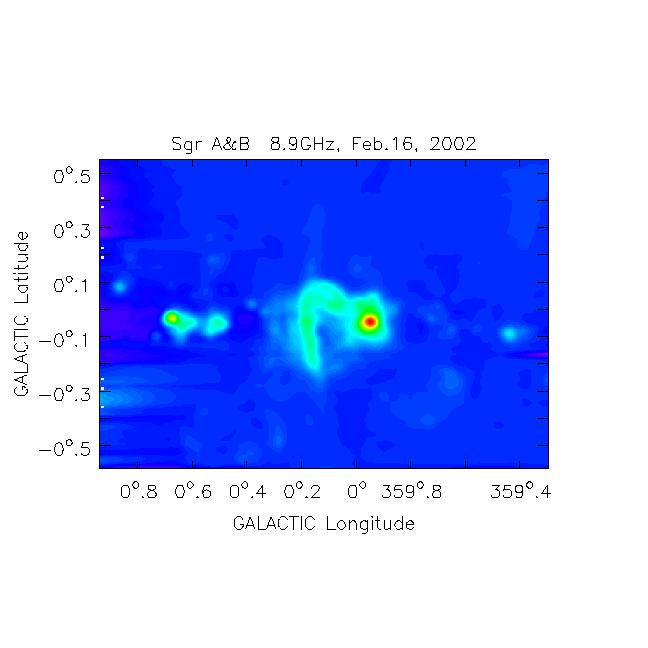
The Galactic Center - deeper view, but more artifacts.
The Galactic Center - in Galactic coordinates.
3C147
3C147 is a point source. The dynamic range is about 1200.
You can just barely see a hint of the first sidelobes.
W51, a region of molecular clouds.
The dynamic range is about 4000.
S171, or W1
Here the source is rather weak, and the dynamic range is
only about 10, so streaks and hysteresis effects show
up in the image.